Đề bài IELTS Writing task 1 - Dạng bài Bar chart:
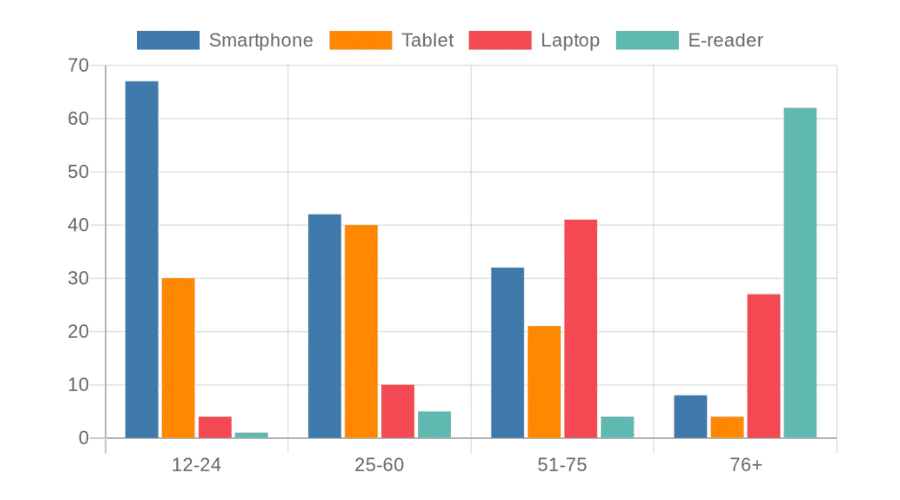
The bar chart below shows the different types of electronic devices used by people in Australia in 2008.
Summarise the information by selecting and reporting the main features, and make comparisons where relevant.
Electronic devices used in Australia in 2008
Chữa đề IELTS Writing task 1 bar chart từ The SOL Education:
The bar chart displays the usage of various electronic devices among four age groups in Australia in 2008.
It is apparent that smartphones were the most popular device across all age groups, except for the oldest group. Laptops and tablets exhibited a mixed pattern of usage, while e-readers were predominantly used by the oldest age group.
Smartphones were highly popular among younger Australians, with 67% of those aged 12-24 using them. The popularity of smartphones decreased with age, as 42% of the 25-50 age group, 32% of the 51-75 age group, and only 8% of those aged 76 and over used them. Tablets showed a more balanced distribution, with the highest usage among the 25-50 age group at 40%, followed by 30% among the 12-24 age group, and lower rates of 21% and 4% for the 51-75 and 76+ age groups, respectively.
In contrast, laptop usage was most prevalent among the 51-75 age group, with 41% of users, followed by 27% among those aged 76 and above. The younger age groups exhibited significantly lower usage, with 10% for the 25-50 age group and just 4% for the 12-24 age group. E-readers displayed a strikingly different pattern, as their usage was overwhelmingly dominated by the oldest age group, with 62% of users being 76 or older. The other age groups demonstrated minimal usage, with 5% for the 25-50 age group, 4% for the 51-75 age group, and a mere 1% for the 12-24 age group