Bài viết mẫu đề IELTS Writing task 1: The graph below shows the percentage of female students on four different course at one university from 1970 to 2015. Summarise the information by selecting and reporting the main features and comparisons where relevant.
The graph below shows the percentage of female students on four different course at one university from 1970 to 2015. Summarise the information by selecting and reporting the main features and comparisons where relevant.
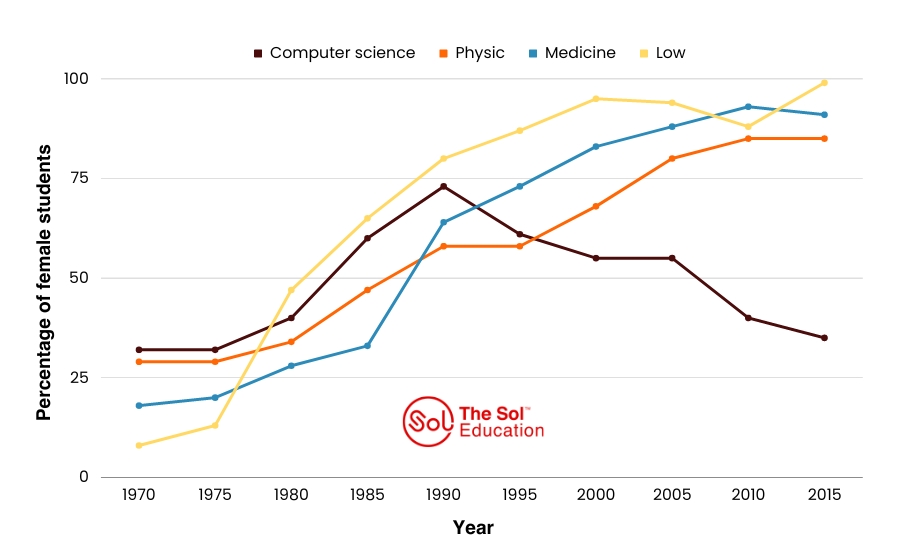
The line chart illustrates the proportion of female students studying various subjects, at a college, from 1970 to 2015. Overall, all courses experienced a rise in the rate of students over the given period, with the most dramatic increase witnessed in the figure for law.
Computer science and physics started the period the highest. Computer science ranked first with roughly 33% of students in 1970 and soared to around 77% in the following twenty years. A sudden plummet from this point saw the proportion decrease to less than 40% by 2015. The percentage of female students taking physics started at approximately 30% in 1970. After a brief plateau at nearly 60% from 1990 to 1995, it ascended continuously to about 87% in 2015.
Concerning the remaining categories, nearly a fifth of females studied medicine in 1970. Subsequently, the figure surged exponentially to around 65% in 1990 and finished at over 90% in the final year. The share of female law students was the lowest in 1970 at just approximately 10%, yet it rose significantly to roughly 50% in 1980, surpassing those of the other three courses. By the end, almost every female in this university took a law course.
(199 words)