The chart below shows information about the favourite subjects of 60 students from two schools, school A and school B.
Summarise the information by selecting and reporting the main features, and make comparisons where relevant
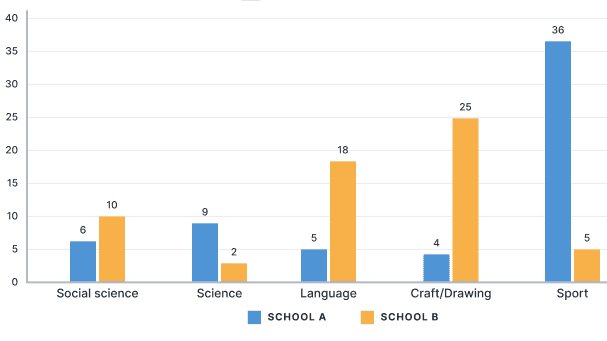
The chart illustrates the preferences of 60 students from two distinct schools, School A and School B, regarding their favorite subjects. The data reveals notable differences in subject popularity between the two institutions.
In School A, Sport emerges as the overwhelmingly favored subject, with 36 students expressing a preference for it. This is significantly higher than any other subject, indicating a strong inclination towards physical activity. Following Sport, Science is the second most popular choice among School A students, with 9 participants, while Social Science and Language attract 6 and 5 students, respectively. Craft/Drawing is the least favored subject at School A, with only 4 students selecting it.
Conversely, School B shows a contrasting trend in subject preferences. Here, Craft/Drawing is the most popular choice, with a remarkable 25 students favoring it. Language follows closely with 18 students, showcasing a strong interest in linguistic skills. Social Science attracts 10 students, while Sport is significantly less popular in this school, with only 5 students selecting it. Science, in stark contrast, is the least favored subject in School B, with just 2 students indicating a preference.
Overall, the data highlights a clear divergence in subject preferences between the two schools, with Sport dominating in School A and Craft/Drawing leading in School B, reflecting differing educational emphases and student interests.
(220 words)