The charts show the Australian school leavers did immediately after leaving secondary school. Summarise the information by selecting and reporting the main features, and make comparison where relevant.
- Loại biểu đồ: Pie charts (3 mốc thời gian: 1980, 1990, 2000)
- Dữ liệu: Việc học sinh Úc làm ngay sau khi tốt nghiệp THPT
- Yếu tố cần lưu ý:
- Introduction: Paraphrase đề + nêu 3 năm.
- Overview: Employment tăng và đứng đầu về cuối kỳ; further education + unemployment giảm; further education luôn thấp nhất
Dưới đây là bài mẫu từ Ms Quỳnh 8.0 IELTS nhà SOL để các bạn tham khảo nhé:
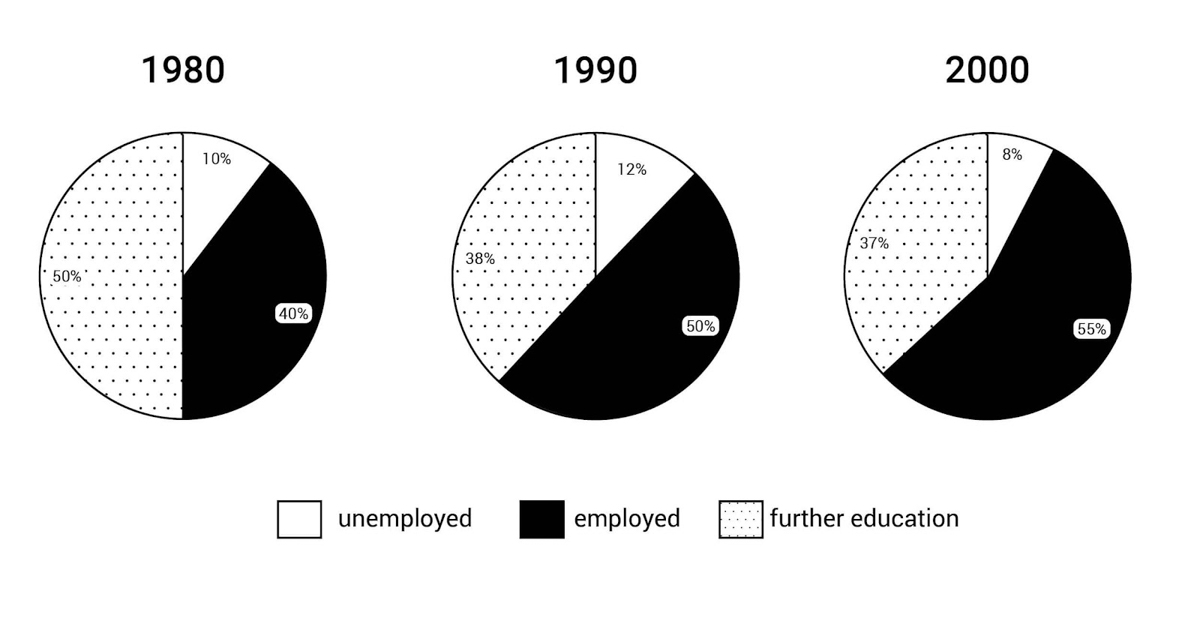
The pie charts illustrate how Australian school leavers immediately did after finishing secondary school in 1980, 1990 and 2000.
Overall, employment became increasingly common and was the largest category by the end of the period. By contrast, the shares of students entering further education and unemployment fell with the latter remaining the smallest segment in all three years.
In 1980, further education was the most popular option, accounting for 50% of school leavers, whereas 40% found employment and 10% were unemployed. By 1990, employment rose to 50%, overtaking further study, which dropped to just under two-fifths. Meanwhile, the proportion of students who were jobless increased slightly by 2%, hitting the highest point over the given period.
In 2000, the upward trend in employment continued, reaching approximately 55%. In contrast, the share choosing higher education declined further to 37%. Similarly, but to a lesser extent, the unemployment rate then fell to 8%, remaining the lowest percentage in all given categories.
(159 words)