The charts show world pineapple exports by the top three pineapple-producing countries in 2009 and 2019, and a breakdown of the cost to the consumer of each pineapple in 2019.
Summarise the information by selecting and reporting the main features, and make comparisons where relevant.
You should spend about 20 minutes on this task.
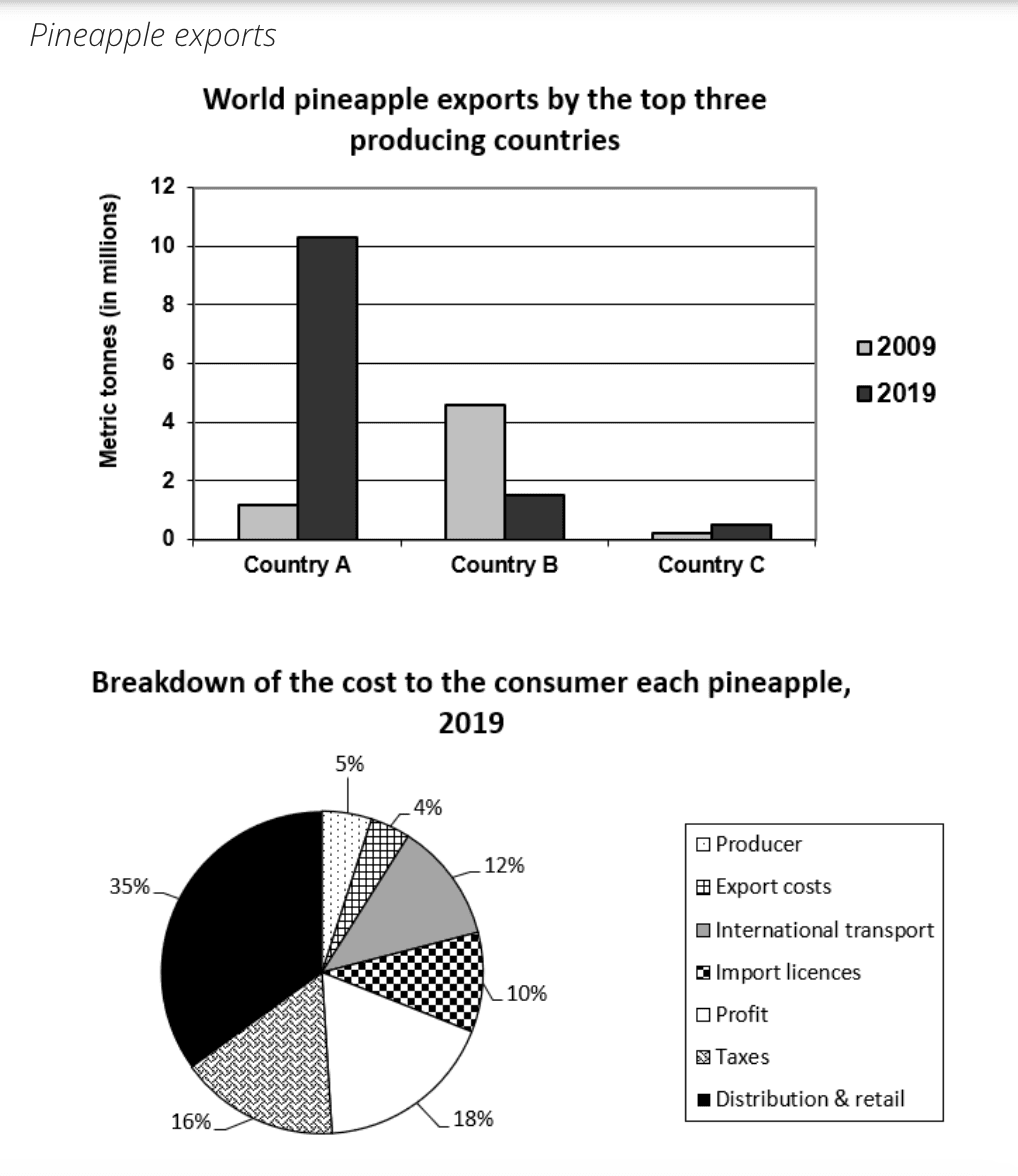
The charts illustrate the world pineapple exports from the top three producing countries in 2009 and 2019, alongside a breakdown of the consumer cost for each pineapple in 2019. Overall, there is a significant increase in exports from Country A, while Country B experienced a notable decline. The cost breakdown reveals how various factors contribute to the final price of pineapples for consumers.
In 2009, Country B led the pineapple exports with 4.6 million metric tonnes, followed by Country A with 1.2 million metric tonnes and Country C with a mere 0.2 million metric tonnes. However, by 2019, the scenario changed dramatically. Country A surged to 10.2 million metric tonnes, establishing itself as the dominant exporter. In contrast, Country B's exports plummeted to 1.6 million metric tonnes, while Country C saw a modest increase to 0.6 million metric tonnes.
Regarding the cost breakdown for consumers in 2019, distribution and retailaccounted for the largest share at 35%, followed by taxes at 16%. Profit margins constituted 18%, and international transport costs made up 12%. Other expenses included import licences at 10% and producer costs at just 5%. This distribution highlights the significant impact of distribution and retail on the final price of pineapples, which could influence consumer purchasing decisions.
(208 words)
The provided charts illustrate the world pineapple exports from the top three producing countries in 2009 and 2019, alongside a breakdown of the consumer cost for each pineapple in 2019. Overall, it is evident that there were significant changes in export volumes over the decade, with notable fluctuations among the countries, while the consumer cost structure reveals various contributing factors.
In terms of pineapple exports, Country A experienced a remarkable increase from 1.2 million metric tonnes in 2009 to 10.2 million metric tonnes in 2019, marking the highest growth among the three countries. Conversely, Country B saw a decline in its exports, dropping from 4.6 million metric tonnes in 2009 to just 1.6 million metric tonnes in 2019. Meanwhile, Country C's exports showed modest growth, increasing from 0.2 million metric tonnes to 0.6 million metric tonnes during the same period.
The breakdown of pineapple costs to consumers in 2019 reveals that distribution and retailaccounted for the largest share at 35%. Additionally, taxes represented 16%, while profit margins stood at 18%. Other components included international transport (12%), import licenses (10%), export costs (4%), and the producer's share at a mere 5%. This detailed cost structure illustrates the complexities involved in the pineapple supply chain and emphasizes the significant role of distribution in the final pricing.
(215 words)