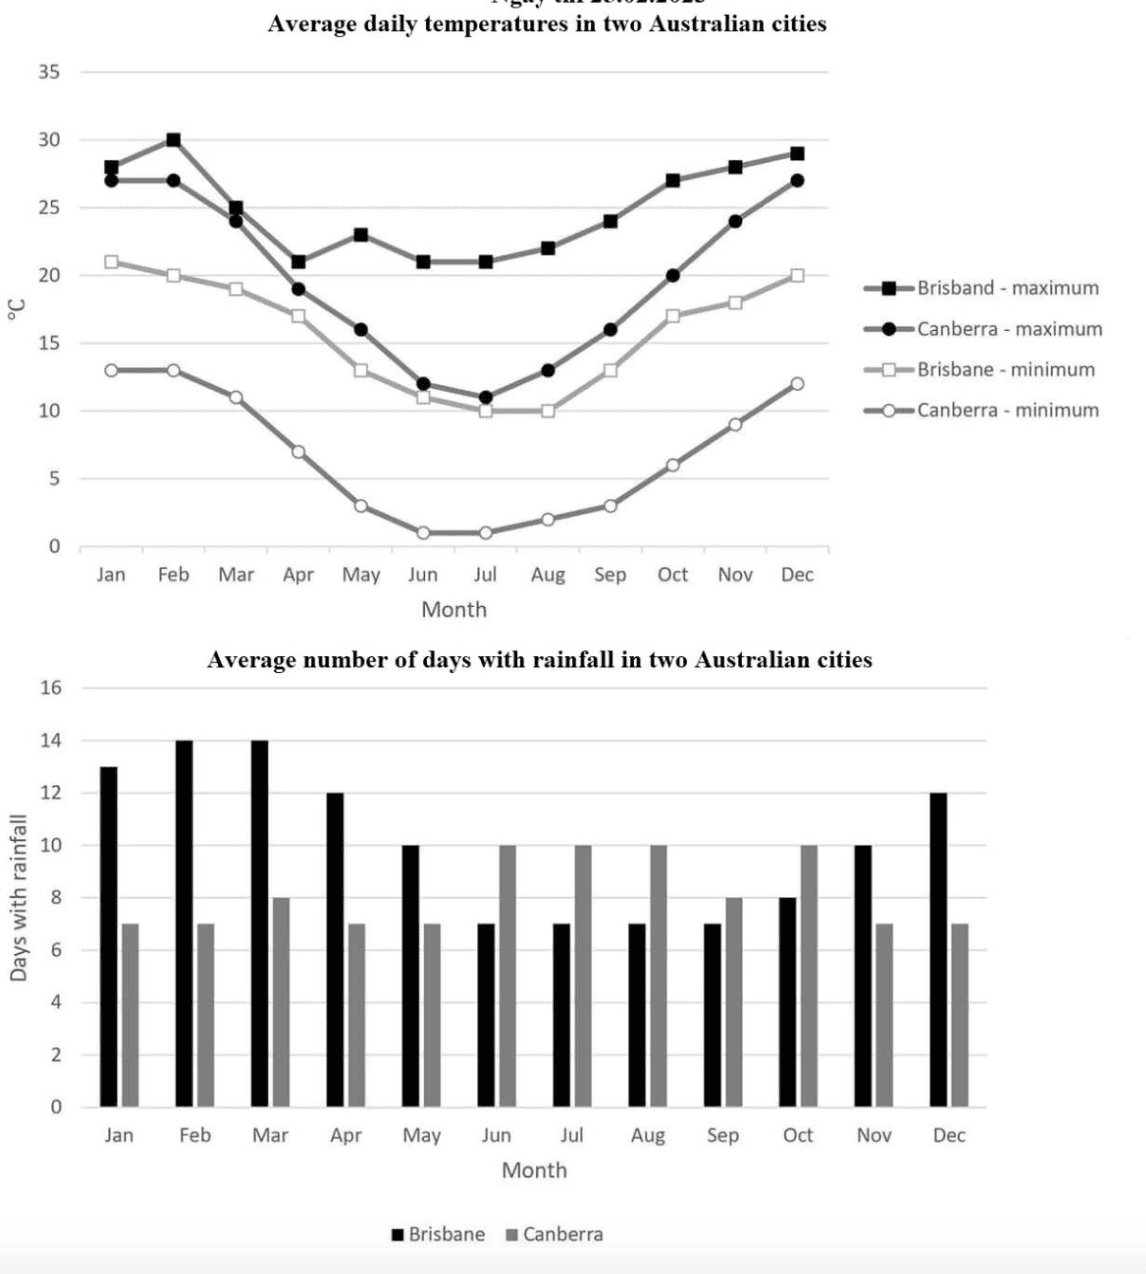
The graph and chart below give information on the average daily maximum and minimum temperatures in degrees Celsius (°C) and the average number of days with rainfall each month for two Australian cities.
Với đề bài dạng Biểu đồ kết hợp (Mixed Graphs) - Biểu đồ đường và biểu đồ cột này, SOL có thể lập dàn ý như sau:
Dưới đây là bài mẫu band 8.0 từ SOL mà các bạn có thể tham khảo:
The provided graph displays the average daily maximum and minimumtemperatures in degrees Celsius (°C) for Brisbane and Canberra, while the accompanying chart illustrates the average number of days with rainfall in each city per month.
Overall, both cities experienced a decline in average daily temperatures from February to July. Brisbane consistently recorded higher temperatures than Canberra. Furthermore, Brisbane generally experienced a greater number of rainy days than Canberra, although Canberra showed a higher number of rainy days between June and October.
In January, both cities had similar average daily maximumtemperatures, around 27°C. Brisbane reached its peak average daily maximumtemperature of 30°C in February, while Canberra's remained relatively constant. From February to July, both cities experienced a decline in maximumtemperatures; Brisbane's dropped to 21°C and Canberra's to 11°C. Subsequently, temperatures in both cities gradually rose, reaching 29°C in Brisbane and 27°C in Canberra by December.
Concerning rainfall, Brisbane saw a relatively constant number of rainy days, fluctuating between 12 and 14 days from December to March. This contrasted with a lower average of 7 days from June to September. Canberra, conversely, exhibited more stable rainfallpatterns, with 7 or 8 rainy days from November to May, increasing to 10 days from June to August.
(198 words)
Từ vựng:
accompanying: kèm theo
recorded: ghi nhận
experienced: trải qua
decline: giảm
relatively constant: tương đối ổn định
fluctuating: dao động
patterns: mô hình
contrasted: tương phản