Trong bài viết này, chúng ta sẽ cùng chữa đề IELTS Writing task 1 dạng mix charts về số giờ làm việc, số ngày nghỉ được trả lương nhé.
Đọc thêm các bài viết về IELTS Writing task 1:
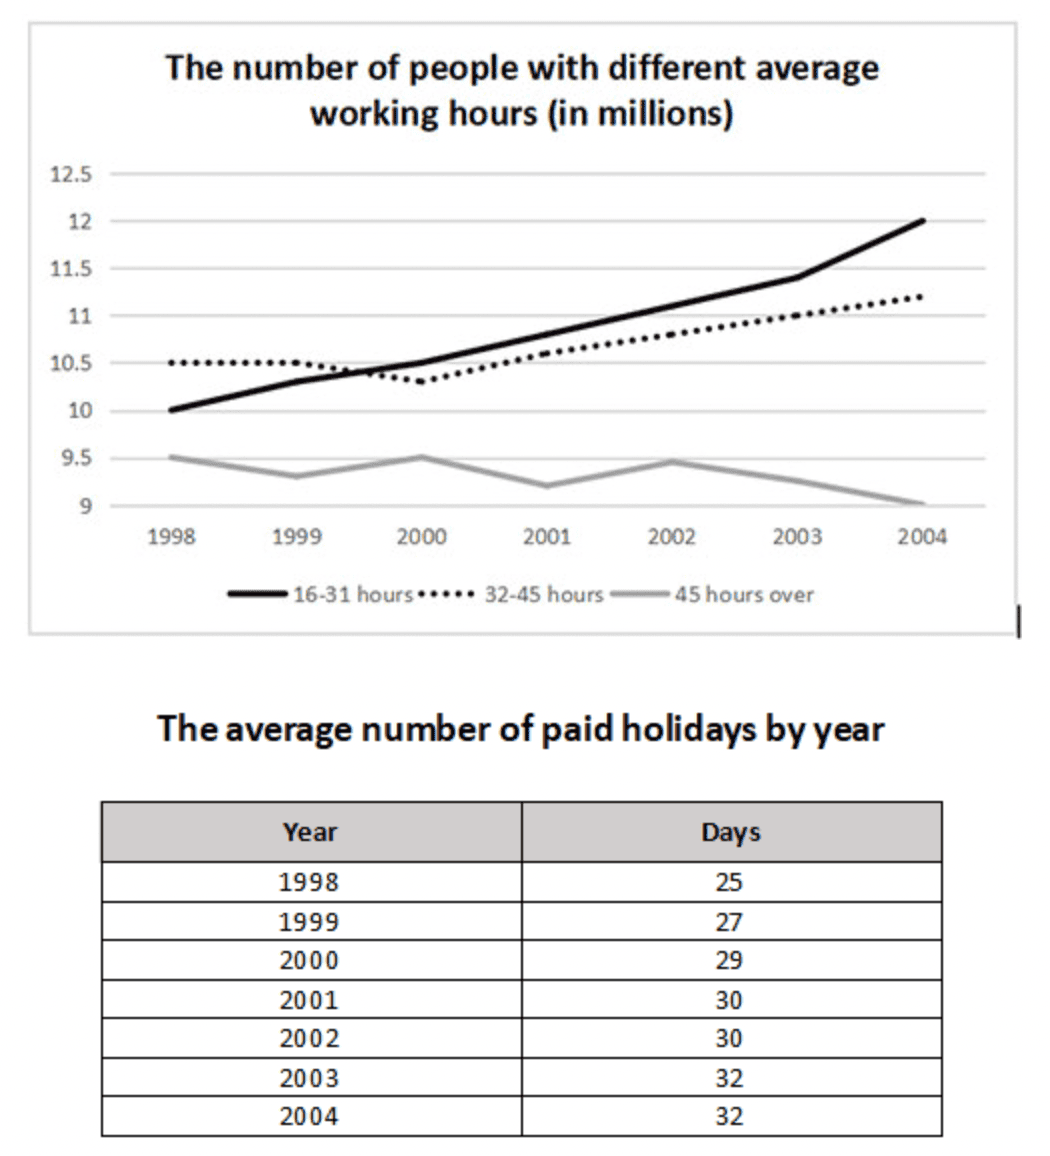
The graph and table show the number of individuals’ working hours and the number of paid holidays from 1998 to 2004.
Summarise the information by selecting and reporting the main features, and make comparisons where relevant.
Phân tích đề và lập dàn ý
The line graph illustrates people’s working hours between 1999 and 2004, while the table depicts how many holidays with pay people enjoyed on average during the same period.
Overall, the number of people working 16-31 hours and 32-45 hours experienced a rise, but fewer individuals worked more than 45 hours; meanwhile, people were entitled to more paid holidays.
Regarding people’s working time, in 1998, 10.5 million people worked 32-45 hours and then the number stabilised in the following year. The figure increased noticeably to just over 11 million in 2004 after it had decreased slightly to approximately 10.4 million in 2000. Although the initial number of people working 16-31 hours was 10 million, it grew significantly by 2 million, overtaking that of people working 32-45 hours in the middle of 1999 and reaching 12 million in 2004. In contrast, people working more than 45 hours had an all-time low number, at 9.5 million in the beginning and 9 million at the end, with some moderate fluctuations in between.
Turning to the average number of paid holidays, people had 25 days in 1998, 27 days in 1999, and 29 days in 2000, and the figure went up to 30 days during the first two years of the 21st century. Luckily, workers got 32 days in 2003 and 2004.
(217 words)